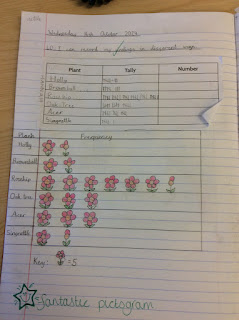
Following our trip, we used our tally charts to draw our own pictograms. These pictograms represented the number of different types of plants and trees we saw on our trip. We also had to relate to our previous maths lessons to remember how to draw our pictograms and work out how many each picture needed to represent.
Here are some examples


